

2016 Flue-Cured Tobacco Survey: Entomology Survey Data
go.ncsu.edu/readext?456534
en Español / em Português
El inglés es el idioma de control de esta página. En la medida en que haya algún conflicto entre la traducción al inglés y la traducción, el inglés prevalece.
Al hacer clic en el enlace de traducción se activa un servicio de traducción gratuito para convertir la página al español. Al igual que con cualquier traducción por Internet, la conversión no es sensible al contexto y puede que no traduzca el texto en su significado original. NC State Extension no garantiza la exactitud del texto traducido. Por favor, tenga en cuenta que algunas aplicaciones y/o servicios pueden no funcionar como se espera cuando se traducen.
Português
Inglês é o idioma de controle desta página. Na medida que haja algum conflito entre o texto original em Inglês e a tradução, o Inglês prevalece.
Ao clicar no link de tradução, um serviço gratuito de tradução será ativado para converter a página para o Português. Como em qualquer tradução pela internet, a conversão não é sensivel ao contexto e pode não ocorrer a tradução para o significado orginal. O serviço de Extensão da Carolina do Norte (NC State Extension) não garante a exatidão do texto traduzido. Por favor, observe que algumas funções ou serviços podem não funcionar como esperado após a tradução.
English
English is the controlling language of this page. To the extent there is any conflict between the English text and the translation, English controls.
Clicking on the translation link activates a free translation service to convert the page to Spanish. As with any Internet translation, the conversion is not context-sensitive and may not translate the text to its original meaning. NC State Extension does not guarantee the accuracy of the translated text. Please note that some applications and/or services may not function as expected when translated.
Collapse ▲As part of our annual flue-cured tobacco production surveys, we ask county extension agents questions about current insect pest-control practices in flue-cured tobacco. As this information might be of use to other county agents and various stakeholders in tobacco production, we are sharing the survey results on the tobacco portal.
Survey Response
Response to the survey covered 85,248 acres of flue-cured tobacco production in 17 counties across NC.
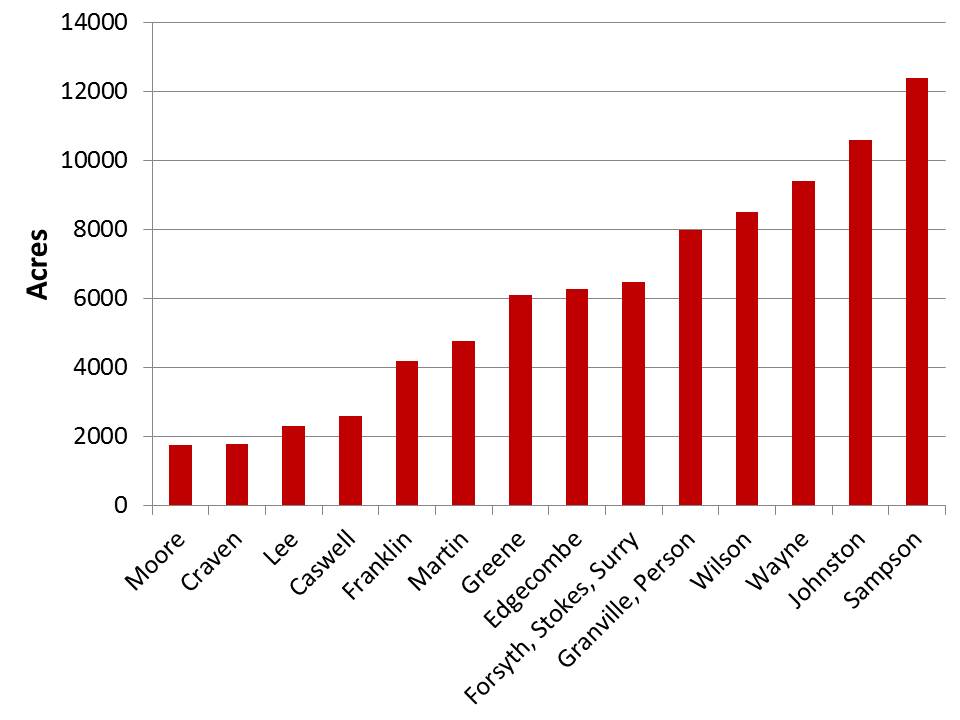
Table 1. Acres responding to survey by county
To see how this response compares to previous years, see our 2015 post on survey methods and response.
Greenhouse Pest Control
The past three years, acephate (Orthene) was the most common non-neonicotinoid applied to treat pests in greenhouses with an estimated 50% of 80,695 reporting acres treating with it in 2014, an estimated 26% of 105,292 reporting acres treating with it in 2015, and an estimated 24% of 75,405 reporting acres treating with it in 2016.
Soil-Applied Insecticides
In 2014 and 2015, around 70% of reporting acreage was transplanted with plants treated with soil-applied neonicotinoids in the greenhouse. In 2016, that number decreased to around 50% of reporting acres. For more information about using soil-applied insecticides, see the North Carolina Agricultural Chemicals Manual.
Table 1: Percentages of transplants treated with neonicotinoids in the greenhouse.
| Insecticide | Acres responding to question | Percentage of acreage planted with treated plants | ||||
| 2014 | 2015 | 2016 | 2014 | 2015 | 2016 | |
|---|---|---|---|---|---|---|
| Admire and generic imidacloprid | 85,069 | 64,692 | 64,484 | 69.7 % | 65.0 % | 42.8 % |
| Platinum (thiamethoxam) | 55,789 | 56,461 | 49,071 | 6.0 % | 9.6 % | 7.2 % |
Foliar Pests and Insecticide Applications
Caterpillars were the pests most consistently treated with foliar insecticides. Pre-topping, around 70% of reporting acres were treated for tobacco budworms (Heliothis virescens), and post-topping around 50% of reporting acres were treated for tomato and tobacco hornworms (Manduca spp.) For more information on pest insects, see our insect IPM page.
Table 3. Percentage of acreage treated for common pre-topping pests.
| Pre-Topping Pest | Total Acres Responding to Question | Percentage of Acres Treated for Pest | ||||
| 2014 | 2015 | 2016 | 2014 | 2015 | 2016 | |
|---|---|---|---|---|---|---|
| Aphids | 78,035 | 48,460 | 54,857 | 23.57 % | 8.62 % | 5.7 % |
| Flea Beetles | 74,669 | 40,942 | 52,038 | 5.88 % | 5.36 % | 4.3 % |
| Tobacco Budworms | 85,069 | 64,692 | 70,548 | 72.77 % | 75.99 % | 62.7 % |
| Tobacco/Tomato Hornworms | 81,269 | 54,960 | 64,448 | 26.32 % | 40.11 % | 17.9 % |
| Suckfly | 55,789 | 31,400 | 31,657 | 0.06 % | 0.00 % | 0.0 % |
| Japanese Beetles | 55,789 | 31,400 | 31,657 | 0.06 % | 0.41 % | 0.2 % |
| Other (Stink Bugs, Grasshoppers, etc.) | 60,589 | 31,400 | 49,767 | 0.62 % | 1.74 % | 4.1 % |
Table 4. Percentage of acreage treated for common post-topping pests.
| Post-Topping Pest | Total Acres Responding to Question | Percentage of Acres Treated for Pest | ||||
| 2014 | 2015 | 2016 | 2014 | 2015 | 2016 | |
|---|---|---|---|---|---|---|
| Aphids | 66,910 | 45,030 | 44,990 | 5.9 % | 6.7 % | 4.3 % |
| Flea Beetles | 62,787 | 59,836 | 51,271 | 10.6 % | 15.6 % | 10.2 % |
| Tobacco Budworms | 74,098 | 40,942 | 45,171 | 13.8 % | 2.0 % | 3.9 % |
| Tobacco/Tomato Hornworms | 76,403 | 64,692 | 62,548 | 59.2 % | 65.0 % | 46.4 % |
| Suckfly | 53,494 | 31,400 | 36,290 | 0.0 % | 0.0 % | 0.0 % |
| Japanese Beetles | 53,593 | 31,699 | 42,390 | 0.0 % | 5.0 % | 0.5 % |
| Other (Stink Bugs, Grasshoppers, etc.) | 58,096 | 31,699 | 38,890 | 0.7 % | 1.0 % | 2.5 % |
Orthene, Belt, and Coragen were the most commonly applied insecticides. For more information about using foliar insecticides, see the North Carolina Agricultural Chemicals Manual.
Table 5: Foliar insecticide applications.
|
Pesticide |
Total Acres Responding to Question | Percentage of Acres Treated | Average number of applications per season | ||||||
| 2014 | 2015 | 2016 | 2014 | 2015 | 2016 | 2014 | 2015 | 2016 | |
|---|---|---|---|---|---|---|---|---|---|
| Actara | 57,989 | 44,317 | 36,290 | 1.4% | 1.0% | 2.1% | 0.6 | 0.8 | 0.8 |
| Bacillus thuringiensis (Bt) | 71,889 | 64,692 | 53,848 | 11.8% | 19.9% | 14.5% | 1.0 | 1.8 | 1.8 |
| Belt | 81,569 | 64,692 | 62,548 | 43.9% | 45.5% | 26.0% | 1.4 | 1.3 | 1.2 |
| Bifenthrin | 65,289 | 33,131 | 42,390 | 6.8% | 10.0% | 6.2% | 1.0 | 1.3 | 0.9 |
| Blackhawk | 64,581 | 49,363 | 59,948 | 16.7% | 13.8% | 17.1% | 1.1 | 1.1 | 1.3 |
| Brigadier | 46,626 | 17,807 | 47,167 | 0.3% | 1.2% | 1.6% | 0.3 | 0.8 | 0.6 |
| Coragen | 85,069 | 64,692 | 62,548 | 26.2% | 33.0% | 32.9% | 1.2 | 1.3 | 1.1 |
| Denim | 43,126 | 44,317 | 42,571 | 0.1% | 1.7% | 1.3% | 0.2 | 0.5 | 0.5 |
| Fulfill | 43,126 | 31,400 | 36,290 | 0.1% | 0.2% | 0.1% | 0.2 | 0.3 | 0.3 |
| Lannate | 66,877 | 37,187 | 42,390 | 4.7% | 1.5% | 2.3% | 0.8 | 0.4 | 0.7 |
| Orthene | 85,069 | 64,692 | 62,548 | 48.7% | 50.8% | 25.8% | 1.4 | 1.5 | 1.5 |
| Pyganic | 65,781 | 33,131 | 36,290 | 0.8% | 1.3% | 0.8% | 0.9 | 1.4 | 0.8 |
| Sevin | 45,326 | 31,400 | 38,890 | 1.5% | 0.0% | 0.2% | 0.7 | 0.0 | 0.7 |
| Tracer | 58,514 | 37,187 | 43,667 | 3.2% | 1.3% | 2.4% | 0.6 | 0.6 | 0.6 |
| Warrior | 52,626 | 46,919 | 36,290 | 3.8% | 4.7% | 1.5% | 0.6 | 0.9 | 0.8 |
| Other | 43,126 | 30,355 | 28,290 | 1.5% | 3.9% | 4.7% | 0.2 | 0.5 | 1.0 |
Integrated Pest Management Practices
The percentage of acres where a formal scouting program, either by growers scouting or professional scouts/crop consultants, was used to make management decisions ranged between 38%and 59% during the past three years.
| Year | Acres responding to question | Percentage of acreage where formal scouting and thresholds used | Percentage of acreage where contract IPM services were used |
| 2014 | 82,469 | 32.1% | 16.0% |
| 2015 | 64,692 | 32.9% | 27.0% |
| 2016 | 62,548 | 26.0% | 18.6% |
For More Information
2015 Flue-Cured Tobacco Survey: Methods and Response
2015 Flue-Cured Tobacco Survey: Entomology Survey Data