

TSWV Risk Assessments: Using the Tobacco Thrips Flight and TSWV Intensity Predictor
go.ncsu.edu/readext?1069321
en Español / em Português
El inglés es el idioma de control de esta página. En la medida en que haya algún conflicto entre la traducción al inglés y la traducción, el inglés prevalece.
Al hacer clic en el enlace de traducción se activa un servicio de traducción gratuito para convertir la página al español. Al igual que con cualquier traducción por Internet, la conversión no es sensible al contexto y puede que no traduzca el texto en su significado original. NC State Extension no garantiza la exactitud del texto traducido. Por favor, tenga en cuenta que algunas aplicaciones y/o servicios pueden no funcionar como se espera cuando se traducen.
Português
Inglês é o idioma de controle desta página. Na medida que haja algum conflito entre o texto original em Inglês e a tradução, o Inglês prevalece.
Ao clicar no link de tradução, um serviço gratuito de tradução será ativado para converter a página para o Português. Como em qualquer tradução pela internet, a conversão não é sensivel ao contexto e pode não ocorrer a tradução para o significado orginal. O serviço de Extensão da Carolina do Norte (NC State Extension) não garante a exatidão do texto traduzido. Por favor, observe que algumas funções ou serviços podem não funcionar como esperado após a tradução.
English
English is the controlling language of this page. To the extent there is any conflict between the English text and the translation, English controls.
Clicking on the translation link activates a free translation service to convert the page to Spanish. As with any Internet translation, the conversion is not context-sensitive and may not translate the text to its original meaning. NC State Extension does not guarantee the accuracy of the translated text. Please note that some applications and/or services may not function as expected when translated.
Collapse ▲In order to help growers determine if using the following pest management practices for TSWV is appropriate for their fields, the Tobacco Thrips Flight and TSWV Intensity Predictor was developed in collaboration with the NC State Climate Office. These predictions are based on over 30 years of thrips trapping and weather data.
Because it is the time when growers are thinking about Tomato Spotted Wilt Virus (TSWV) management, here is a step-by-step guide on how to use the Tobacco Thrips Flight and TSWV Intensity Predictor to create Current Year TSWV Risk Assessments/Predictions. A separate publication will include how to create Historical TSWV Predictions.
TSWV Management
TSWV is vectored by several species of thrips, and infects many species of plants, including tobacco, tomatoes, peppers, and peanuts. In North Carolina, tobacco thrips are the most significant vector of TSWV in tobacco, but additional thrips species are also significant in other crops.
The available TSWV management tools are all preventative, as no tool has been demonstrated to “cure” the plant once infected. In tobacco, there are three potential management strategies: 1) Greenhouse applications of imidacloprid pre-transplant (Admire Pro® or Wrangler®), 2) Addition of Actigard® to the greenhouse float water prior to transplant, and 3) a greenhouse treatment combination of Actigard® and imidacloprid.
Water transplant or in-furrow applications of imidacloprid are also management tools, as well as foliar applications of Actigard® post-transplant. Greenhouse applications usually show better TSWV management followed by, water transplant and in-furrow applications. Detailed information on these management practices is available in the disease and insect management chapters of the Flue Cured Tobacco Production Guide.
All of these management practices differ in important ways from standard grower practices, so the decision to employ them should be based on your risk of TSWV loss. Specifically, the recommended rate of imidacloprid for TSWV suppression is higher than the rate necessary to control aphids and flea beetles, and using a higher rate of imidacloprid is both more costly and increases the potential for post transplant stunting. Small plants treated with foliar applications of Actigard® also risk stunting, and the label warns against this practice. Greenhouse float water treatments of Actigard® are associated with less stunting than field foliar treatments.
In order to help growers determine if using these management practices for TSWV is appropriate, the Tobacco Thrips Flight and TSWV Intensity Predictor was developed in collaboration with the NC State Climate Office. Because it is the time when growers are thinking about Tomato Spotted Wilt Virus (TSWV) management, here is a step-by-step guide on how to use the Tobacco Thrips Flight and TSWV Intensity Predictor.
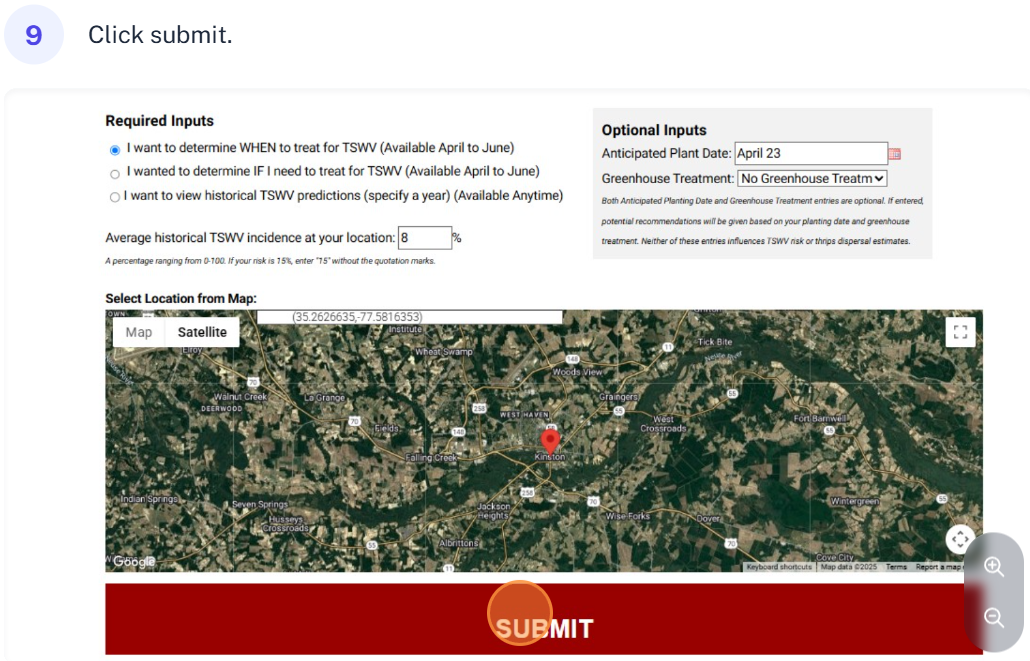
To create a current year TSWV risk prediction you will need the information outlined and the detailed steps outlined below.
-
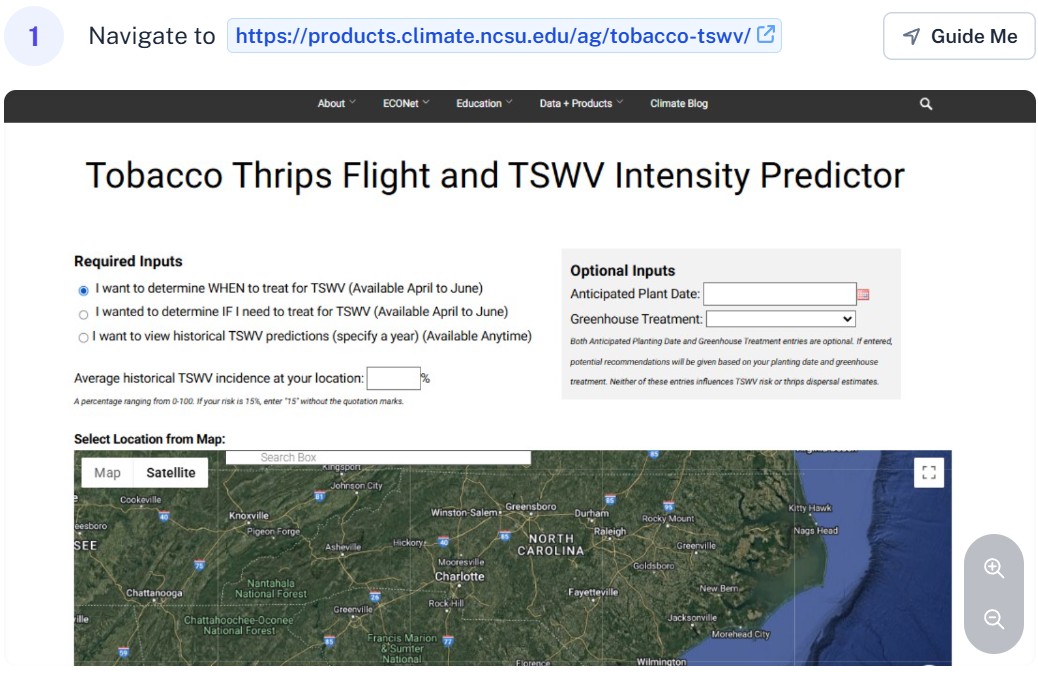
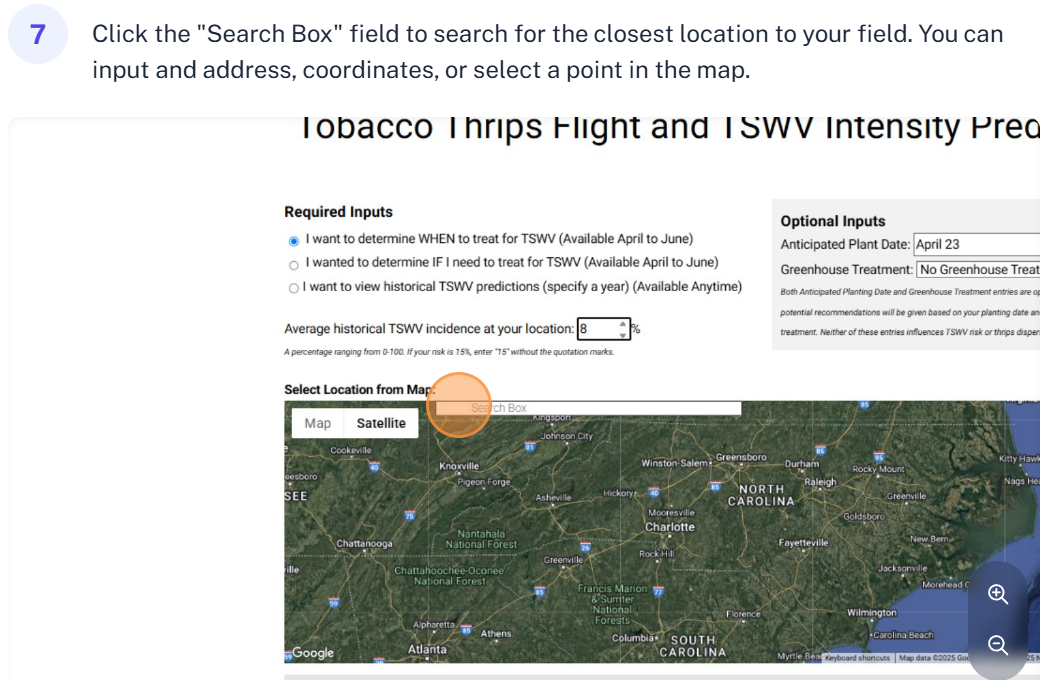
Historical TSWV Incidence: Users input the average historical TSWV incidence (as a percentage) for their location. This data serves as a baseline for the tool’s forecasting.
-
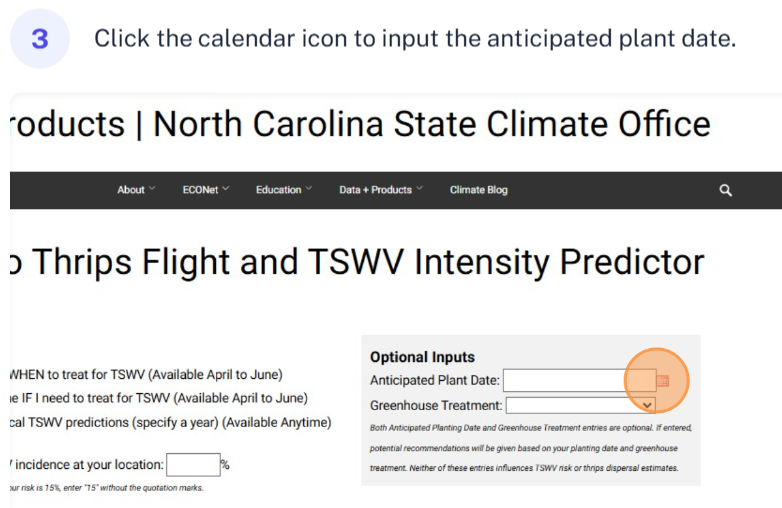
Optional Inputs:
-
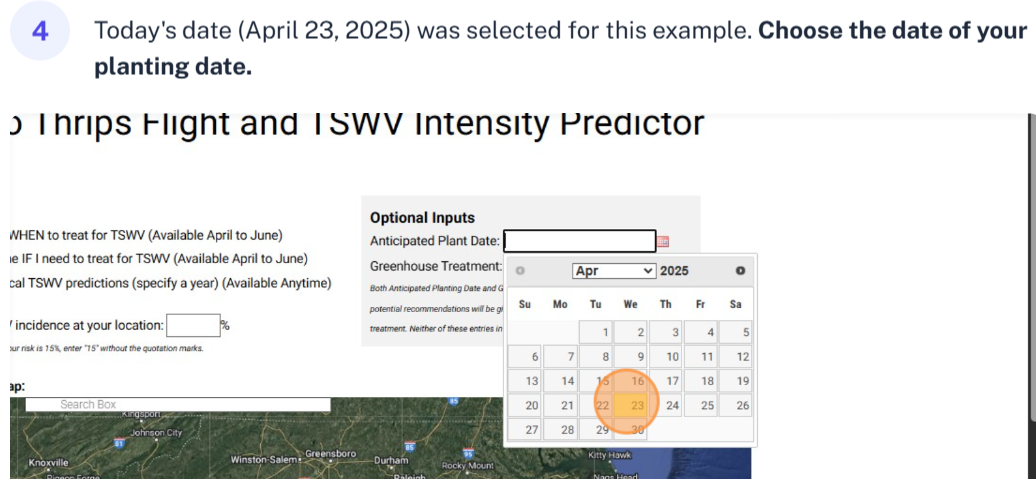
Anticipated Planting Date: While optional, entering this can provide tailored recommendations.
-
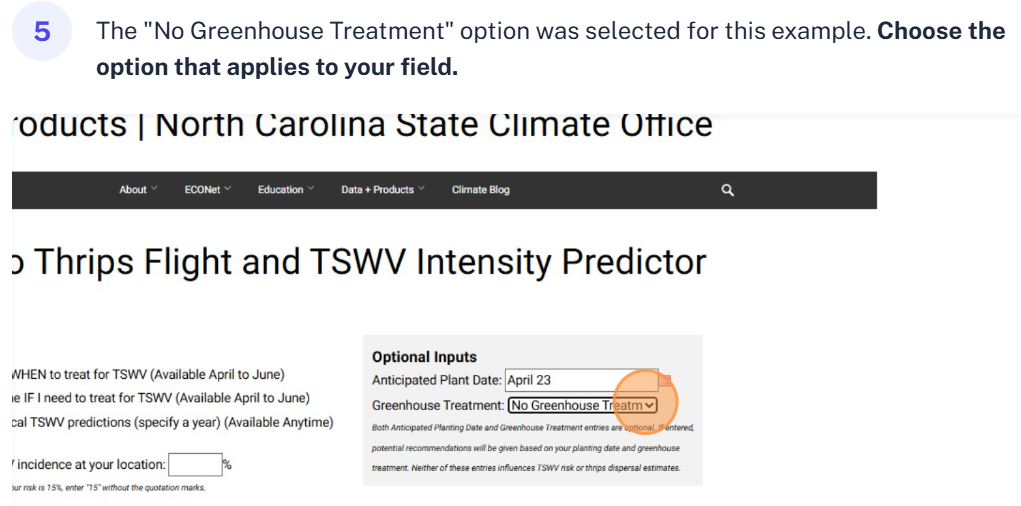
Greenhouse Treatment: Users can specify if they used treatments like Admire Pro® (imidacloprid), Actigard® (acibenzolar-S-methyl), both, or none. These inputs help refine the tool’s recommendations but do not influence the core risk or thrips dispersal estimates.
-
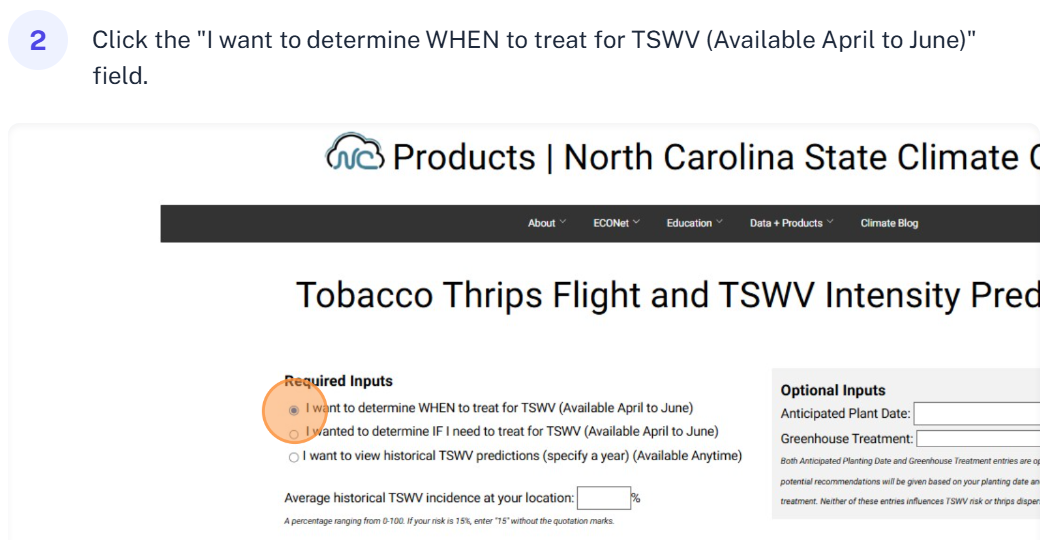
Inputs to determine WHEN to treat for TSWV

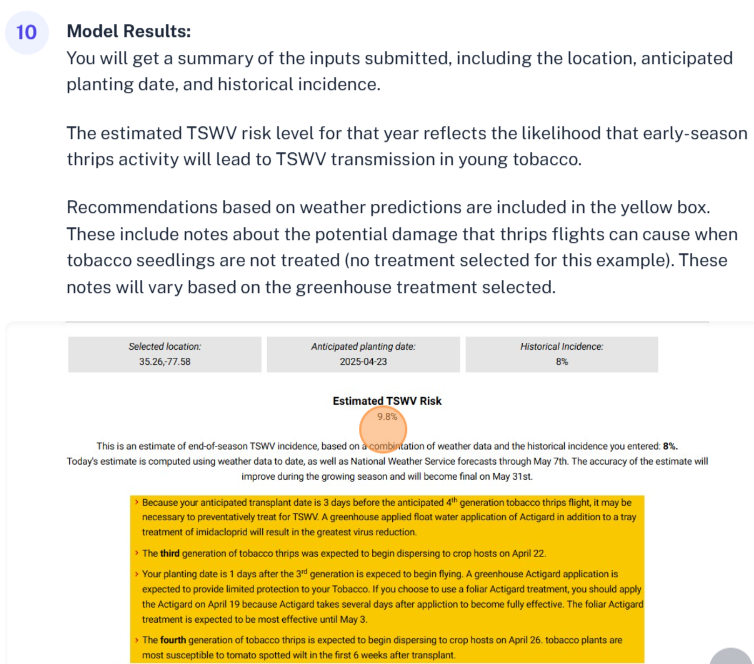
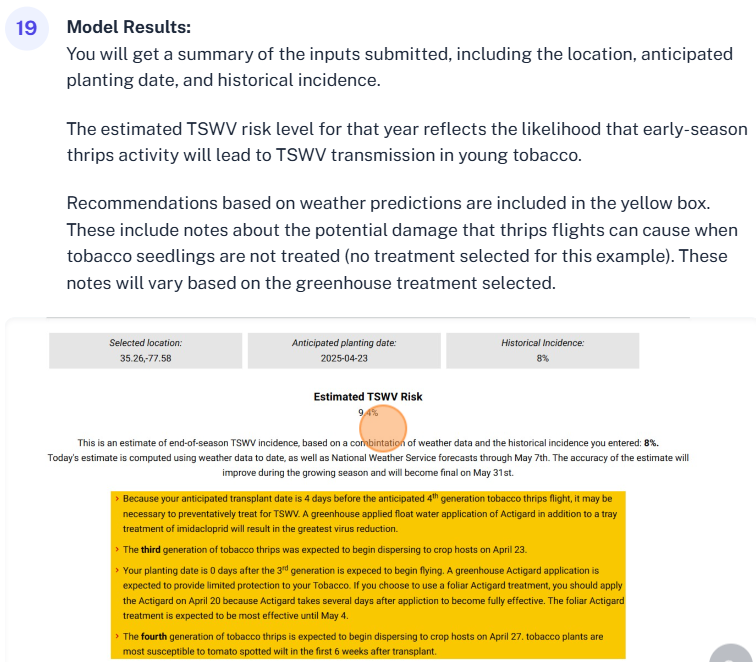
The first information displayed is the estimated end of season risk, which as of today is 9.8% infection in untreated plants. The infection risk displayed will depend on the historically infection percentage you entered, so if you enter data for treated plants, this number will apply to treated plants.
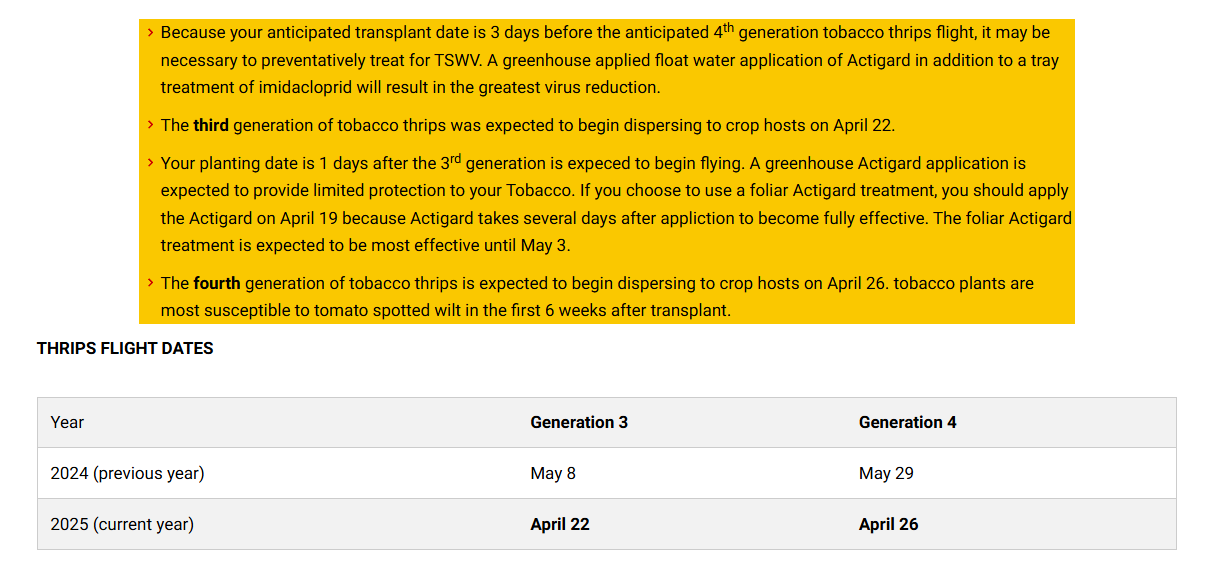
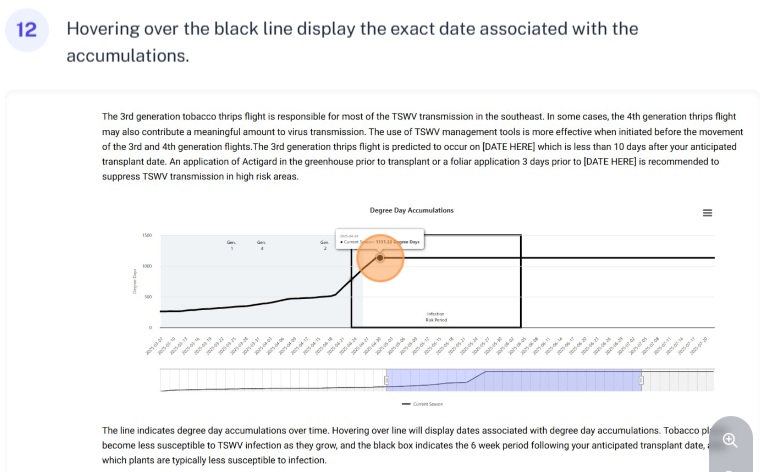
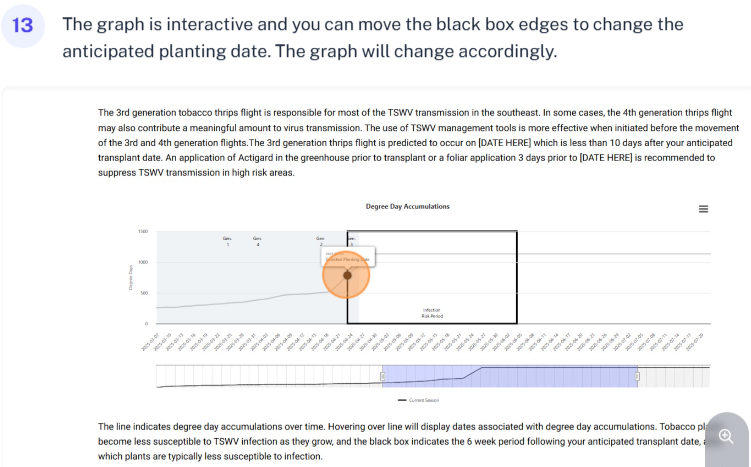
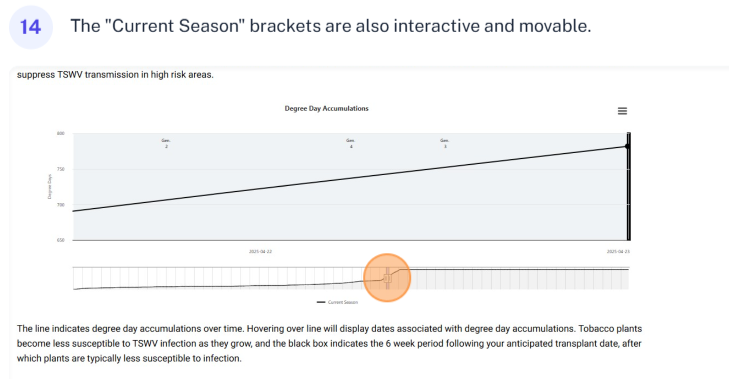
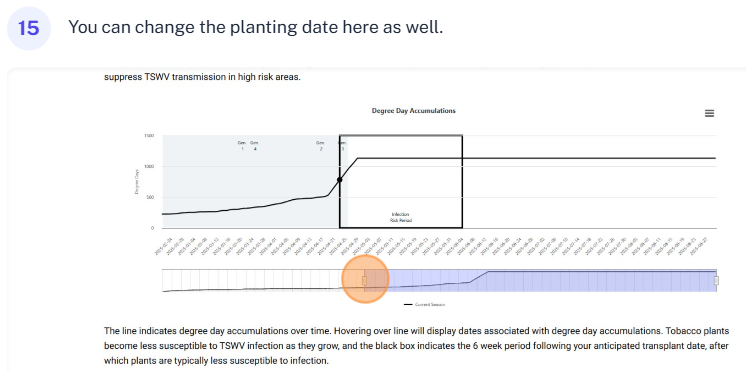
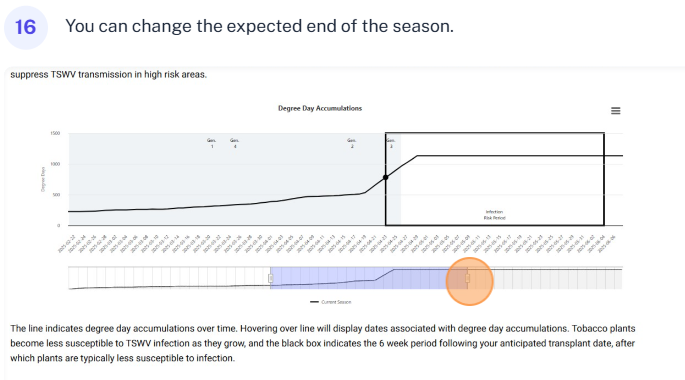
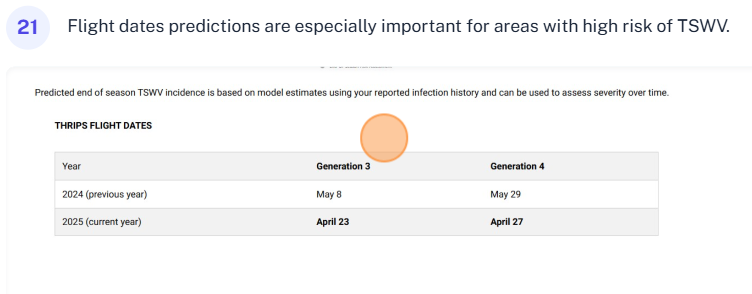
When the 3rd and 4th generation of tobacco thrips are expected to become active (important for determining if a greenhouse or field treatment of Actigard® is most appropriate).
Inputs to determine IF to treat for TSWV
Follow steps 1-17 above and you will obtained results similar to the models indicating WHEN to treat, as shown below.

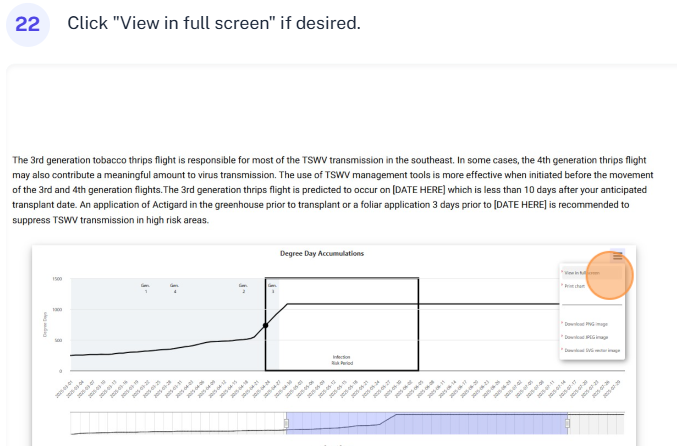
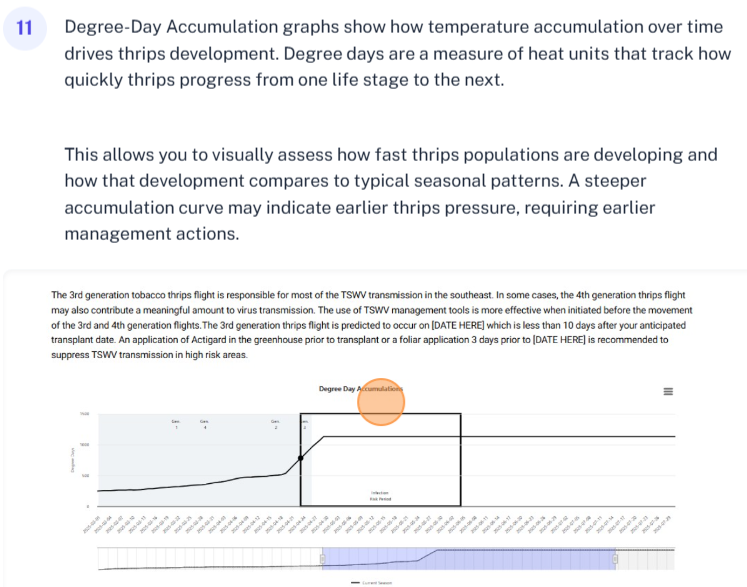
Current year models that are created early in the season are crucial for tobacco growers because they provide timely, location-specific forecasts of thrips flight and TSWV risk during the crop’s most vulnerable stages. By identifying when high-risk thrips generations are expected to occur—particularly the third generation, which typically overlaps with early transplanting—growers can make proactive decisions about insecticide applications, transplant timing, and use of plant activators or systemic insecticides.